25 buildings
40.000 students

Understanding how learning is consumed.
Better academic results, lower number of dropouts and enhance the overall feeling of the organization.

Fontys is one of the largest universities of applied sciences in the Netherlands and offers a variety of bachelors and masters programmes in English. Fontys has the largest number of international students than any other university in the Netherlands, with students of more than 80 nationalities from all over the world. In total Fontys provides full-time and part-time education for 40,000 students per year.

"12CU shows itself as decisive, short communication lines and a good understanding of things"

Rens van der Vorst  – Head of IT Innovation

Phase 1

The need

When the WIFI data project started, the original plan was to retrieve insight into the occupation and use of the Fontys buildings, for example to compare the building’s traffic against the University roster. Until then this type of information was gathered by hand and / or in many cases it didn’t exist at all. 

Our solution

Currently 12CU offers the possibility to gain insight on building, floor and zone level. Work is currently being done on fine-grained reporting at the local and room level and how this fine-grained real-time reporting should be visualized so that it leads to information that is valuable for housing and facilities.

Phase 2

The need

After the first phase had been realized, Fontys asked us whether it would be possible to provide information about how Fontys students consume the education offered, in the sense of how often and how many hours per week they follow education and the students are on campus.

The total number of people present at Fontys can be split into groups (students per lecture or further / staff);

The number of attendees per lecture vs the total of the group;

The average time that attendees spend at Fontys per group / period and building.

Our solution

Based on consultations with Fontys, the Educations analytics dashboard was developed by 12CU in 6 months.

The Education dashboard provides the following information:

The total number of attendees per Fontys (real-time, historical);

The total number of people present at Fontys per building, per floor floor, per zone can be broken down by group;

The number of unique attendees per period (week) vs the total;

12CU SmartSpaces solution
for the Educational market

L1 Education
Dashboard

Software module to gain insight into the consumption of education. Problem to be solved: Based on project-oriented education, there is currently no insight into how often students consume education. This Dashboard shows, including other data, how often students visit and the amount of time they stay on campus.

L2 Occupancy
Dashboard

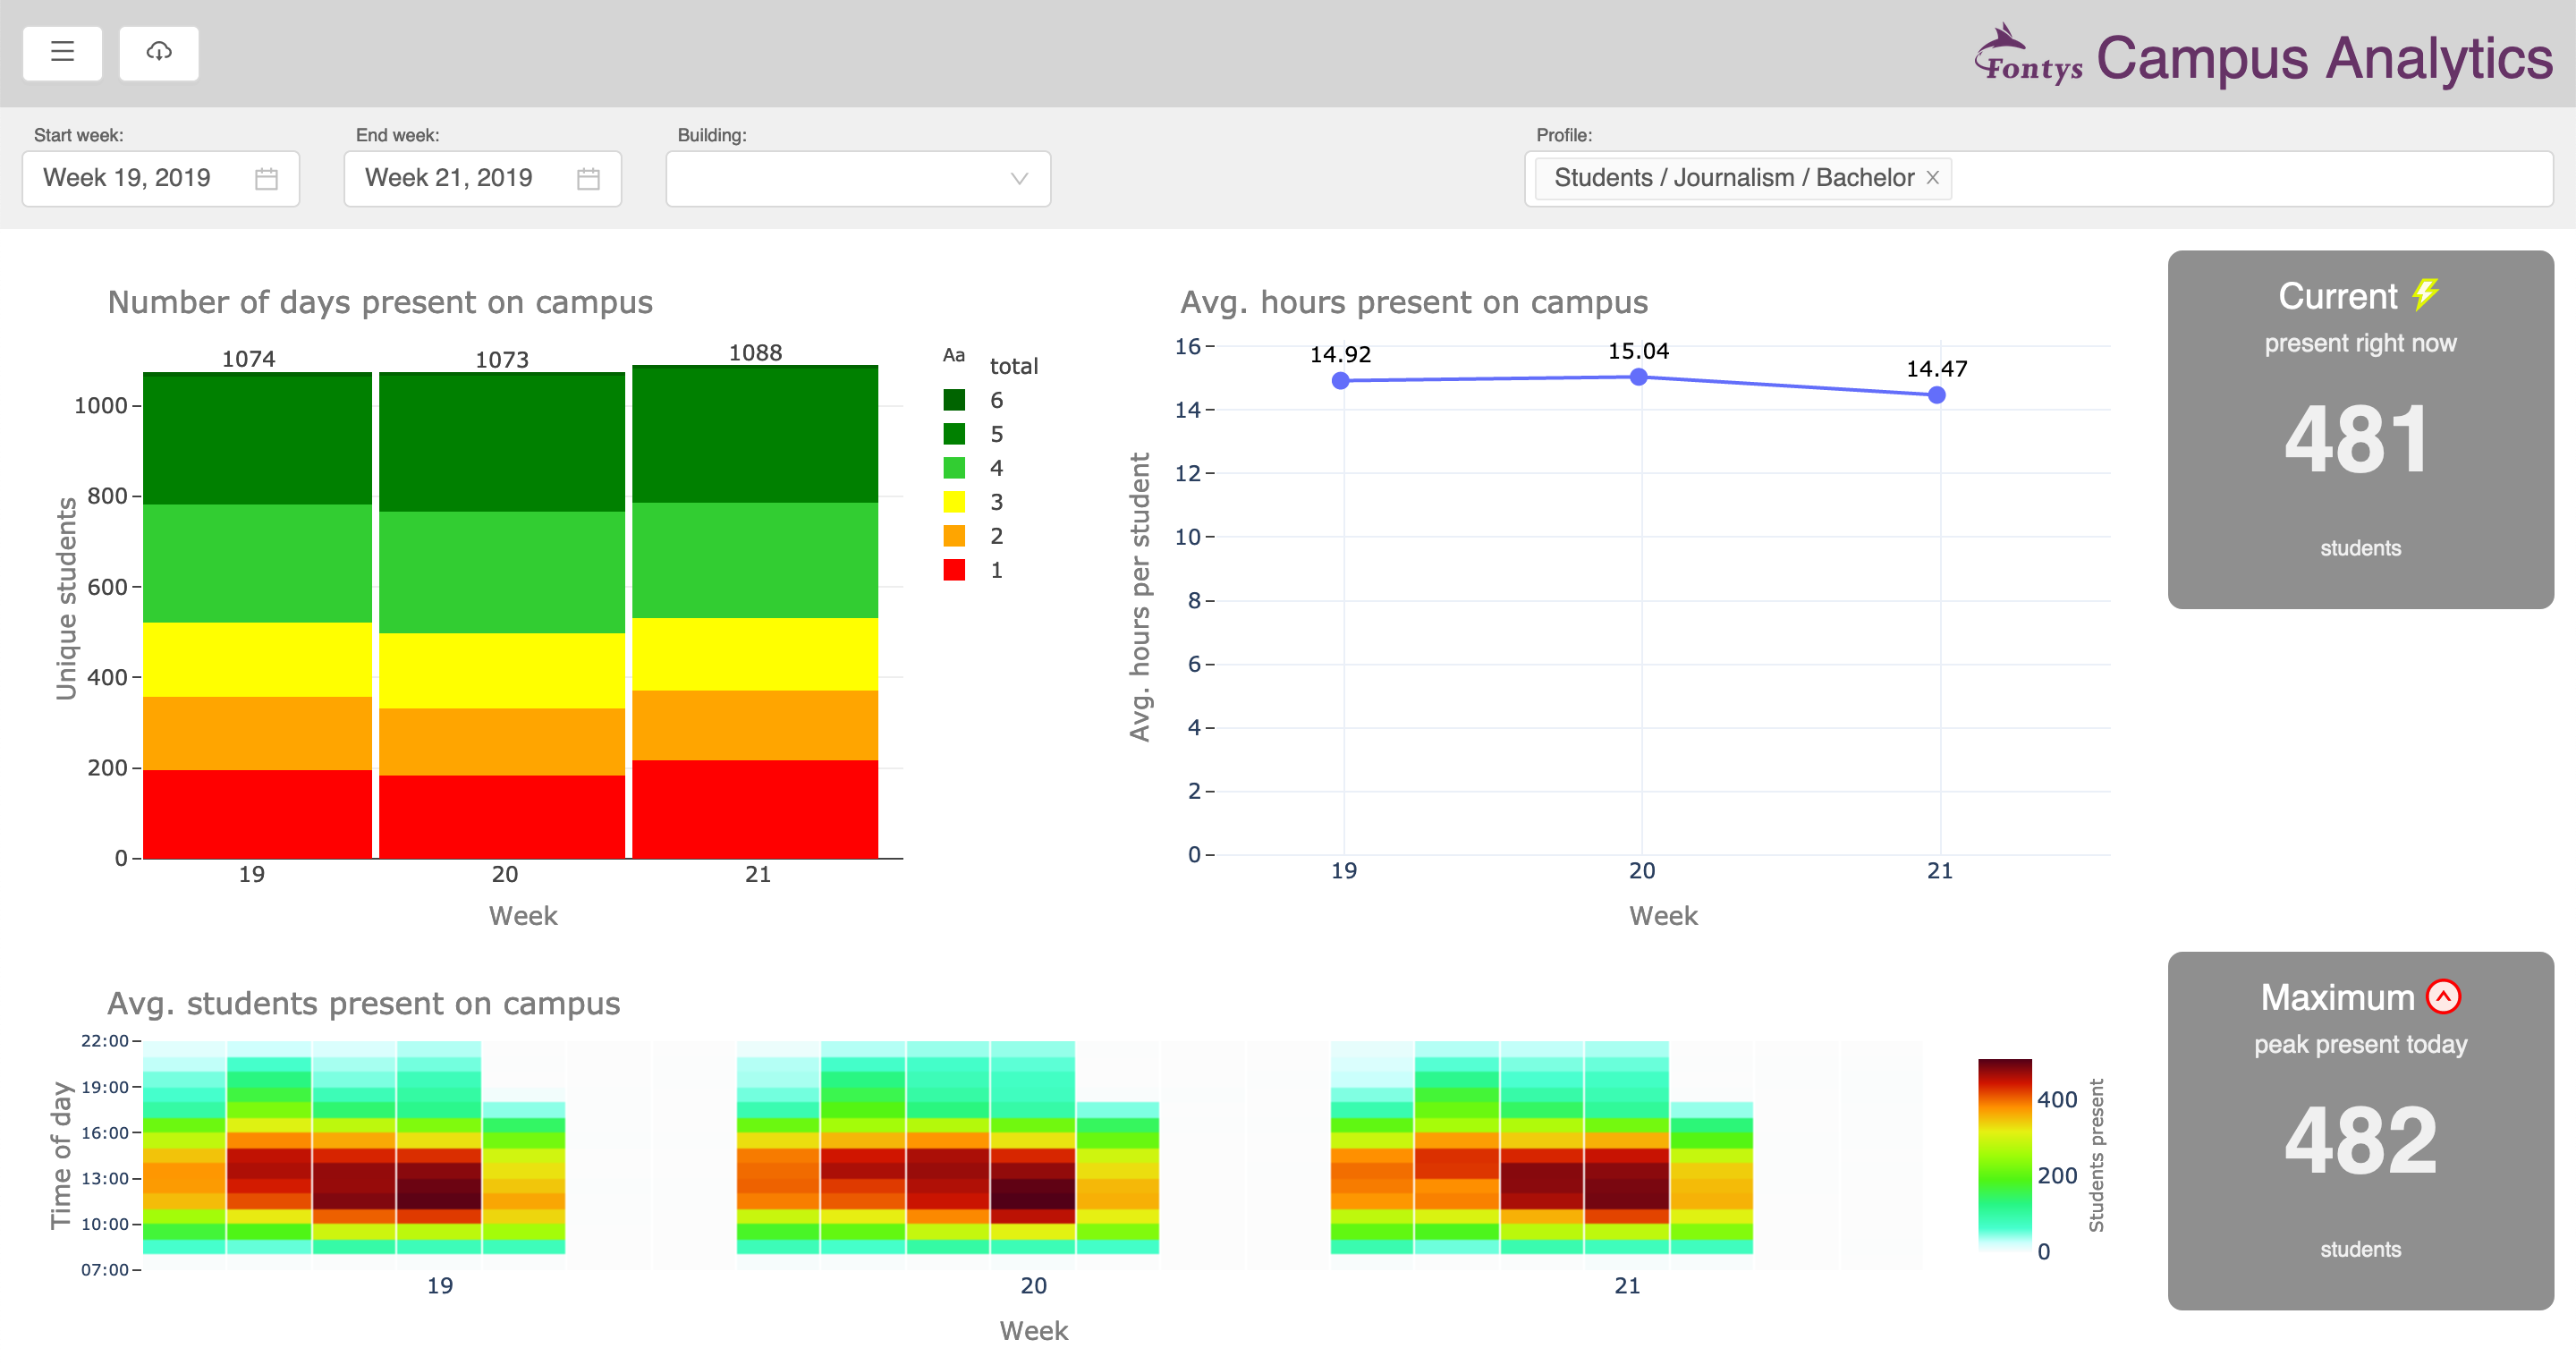
Software module for housing and real-estate managers. Problem to be solved: only 30% of the buildings are actually used. This dashboard provides insight into the occupancy of buildings, floors and zones (parts of a floor). In this dashboard, users can also choose the period, building or buildings and profile (type of students, for example IT students).

L3 Data-lake Hub

12CU data consolidation and business intelligence analyzer. Problem to be solved: The information that 12CU can offer is unique and unavailable from any other source. This is not a dashboard but an API. With this API, educational institutions can fill their own data-lake and create a different cross-section of the data based on combining it with data from other sources. Consider the last in roster systems and HR systems. For example, information can be gathered about which teachers students visit regularly and which teachers students visit less regularly.

Ready to make your space smart?

Do you have questions?
Would you like to request a demo?

Let’s schedule a meeting!

We will get back to you within 24 hours.